
One screen, one set of numbers.
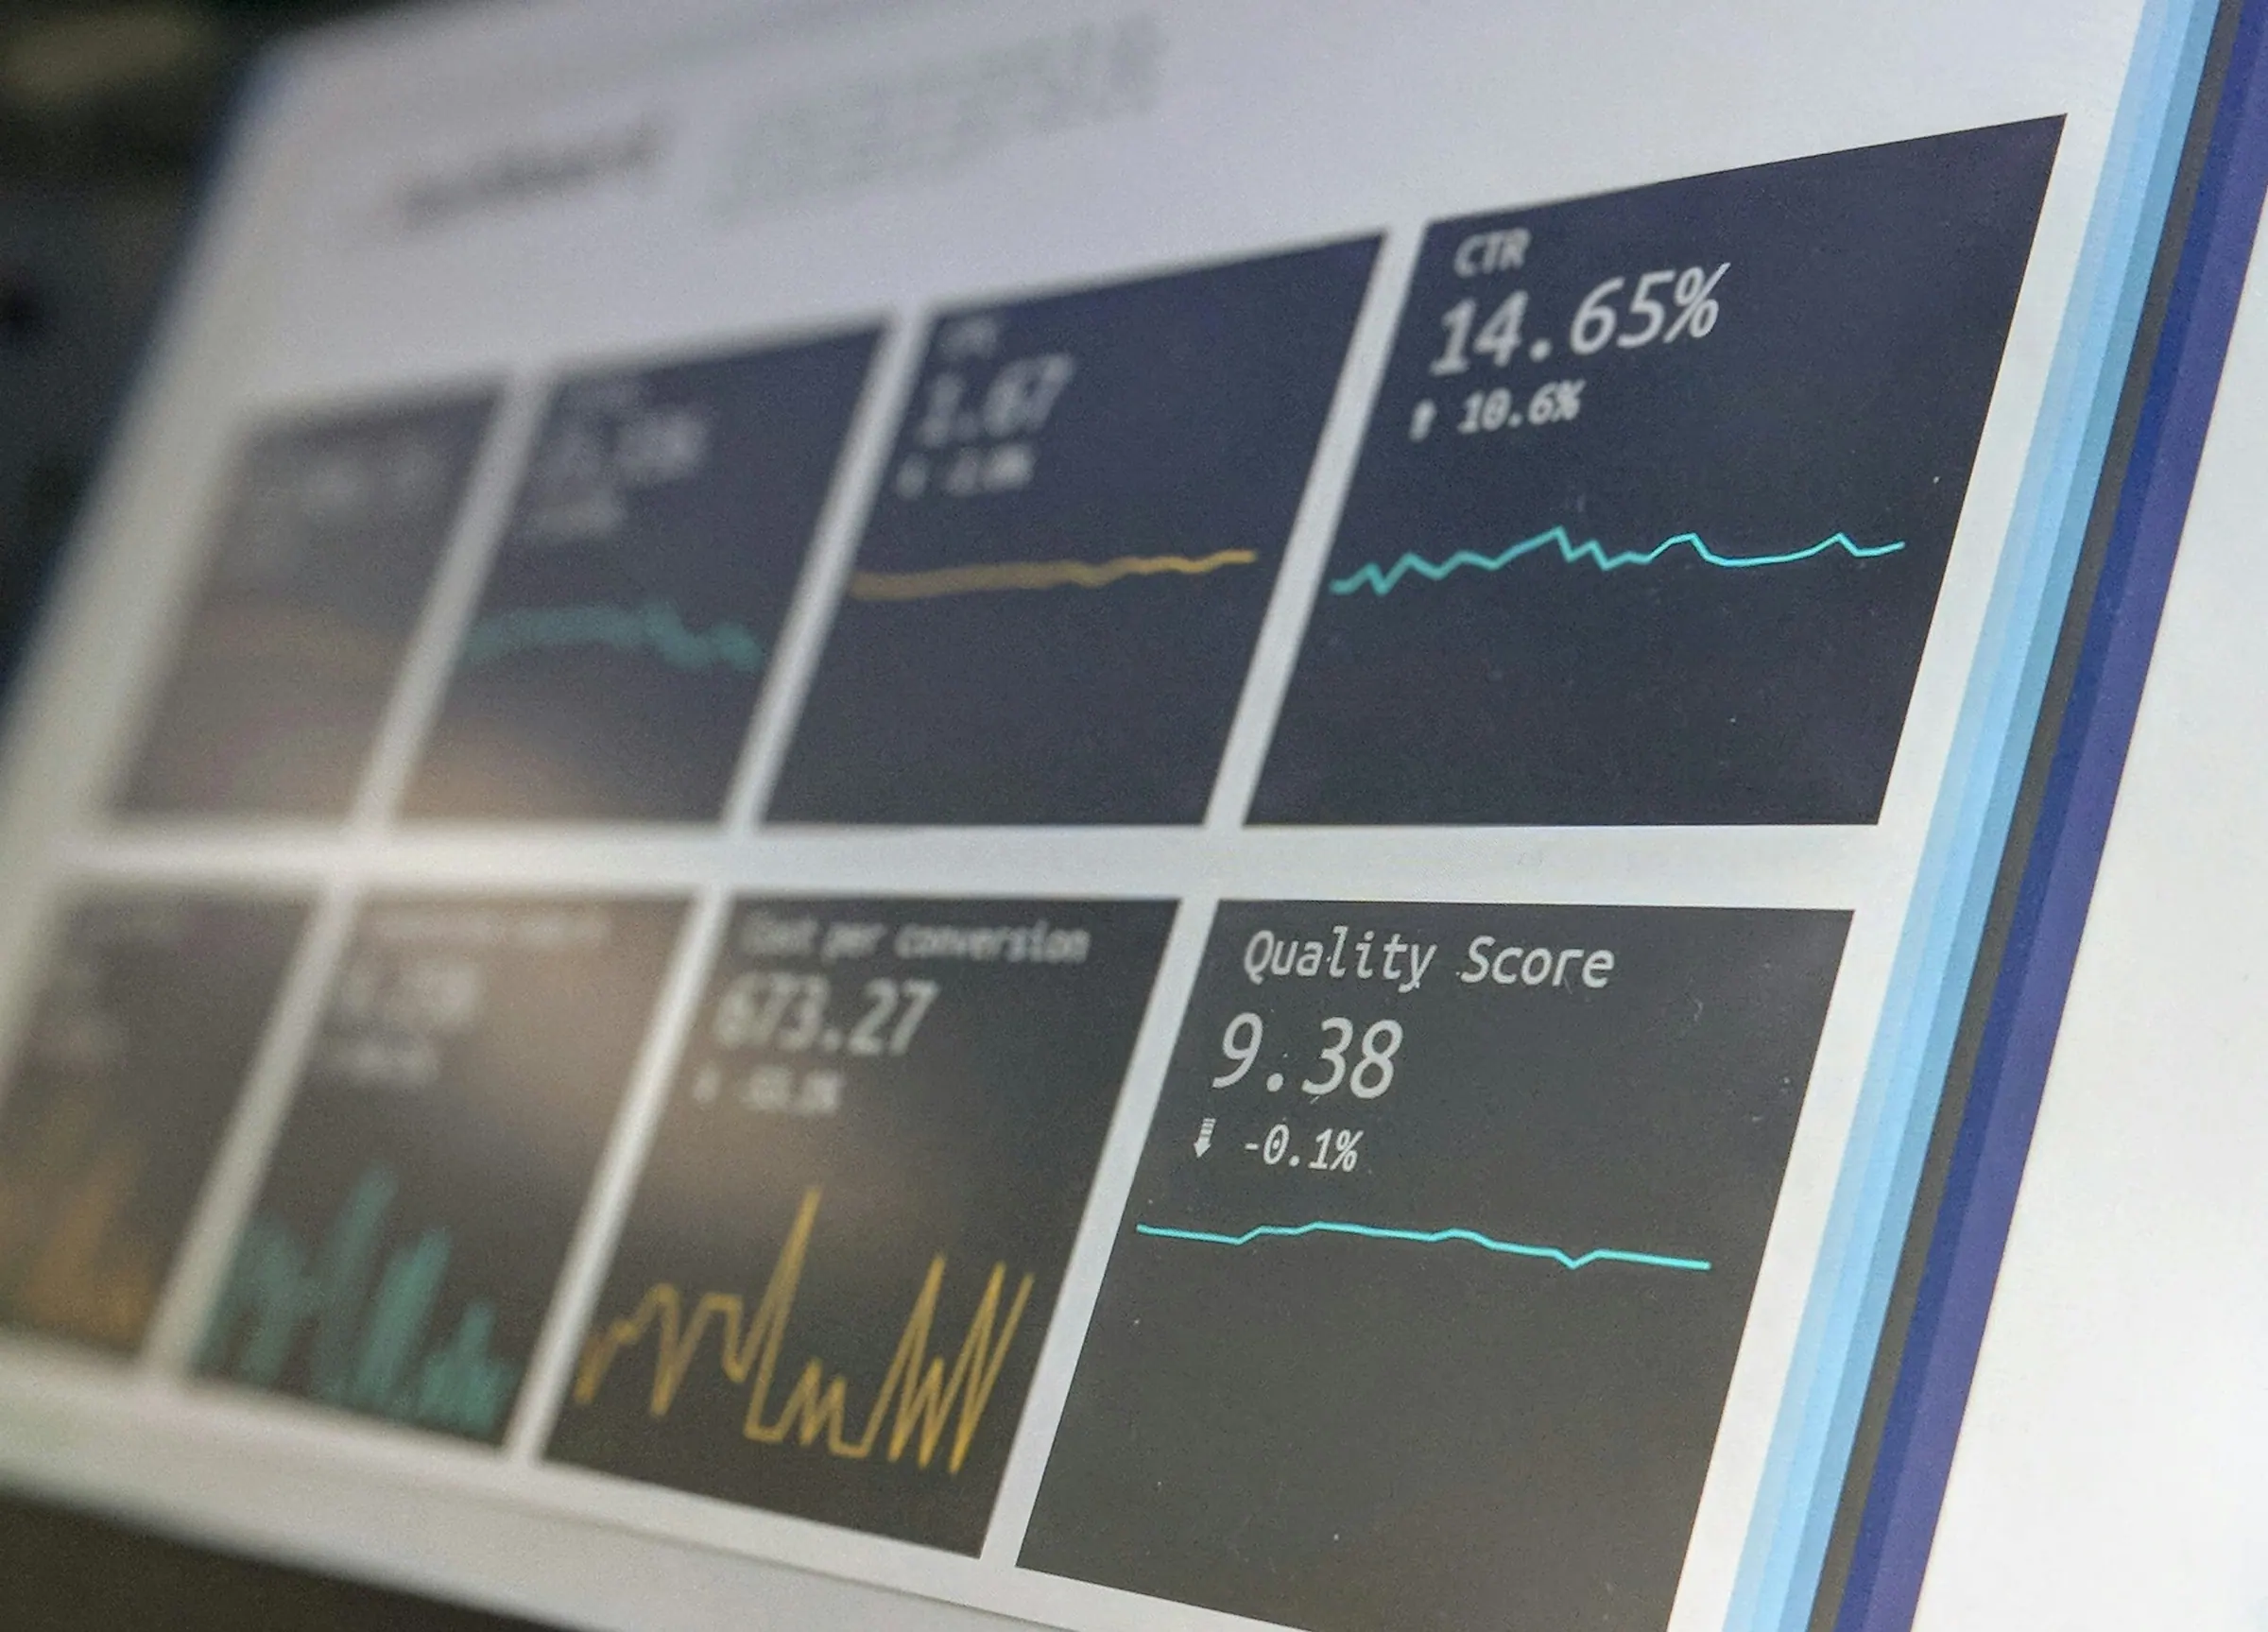
Every platform has its own dashboard and its own numbers. We build one view of orders, spend, cost per order and revenue by channel, from tracking we’ve checked, with the Monday report on top.
- Looker Studio
- GA4
- Shopify
- Ad platforms
- Screen for every channel
- 1
- Numbers that matter, on top
- [8]
- Monday report, your time
- 09:00
 Dashboard · live
Where it sits
- Growth sprintIn it
- Growth partnerIn it
- LaunchIn it
What should an e-commerce marketing dashboard show?
The few numbers that decide what you do next: orders, revenue, ad spend, cost per order and return by channel, new against returning customers, and conversion rate. Ours pulls them into one view from tracking we’ve checked, so the numbers match your store.
- Shows
- Orders, spend, cost per order, revenue by channel
- Sources
- Your store, GA4 and the ad platforms
- Tool
- Looker Studio, or the one you use
- Built on
- Tracking, checked first
- Plus
- The Monday report, every week
A fit, or not yet.
Honest both ways: if it isn’t the right first step, we’ll say which one is.
A good fit if
- You open five dashboards to answer one question.
- Every report you get looks different.
- You want cost per order by channel, any day you look.
Not the right fit if
- Your tracking isn’t set up yet: GA4 and tracking come first.
- You need finance or stock reporting. We build marketing views.
In every dashboard.
The top line
Orders, revenue, spend and cost per order.By channel
Meta, TikTok, Google, email and organic, side by side.New and returning
Who’s buying for the first time, and who’s back.Trends
Week on week, and against the plan’s targets.Shared access
Everyone on your team sees the same numbers.The Monday report
What the numbers mean, and what we’re doing about them.
Tracking first, then the view.
A dashboard on bad data is worse than none, so the tracking comes first.
- Week 1
Check
Tracking audited and the numbers that matter agreed.
Metrics list [Name] · Analytics
- Week 2
Build
The dashboard, connected to the store, GA4 and the ad platforms.
Dashboard, live[Name] · Analytics - Every Monday
Report
The numbers, what they mean and what’s next.
Monday report[Name] · Analytics - Week 6
Review
What you use, what you don’t, and the changes.
Dashboard review Saimul Islam · Founder
Where it sits.
Growth sprint
Included[Price]per [6]-week sprintThe Monday report, in every sprint.
Start a sprintGrowth partner
Included[Price]per month · [3]-month startIncluded, with the Monday report.
Book a callLaunch
Included[Price]per projectA launch-day dashboard.
Plan a launch
Prices are per plan, not per service. Every plan includes the audit, the 90-day plan and the Monday report.
Questions about dashboards.
Not on the list? Ask on a call, or by email.
Looker Studio for most stores: it’s free and connects to GA4 and the ad platforms. [If you already use another tool, we build in that.]
No. The dashboard shows the numbers on any day; the Monday report says what they mean, what we tested and what runs next.
[Answer to write.]
 Still have questions?Saimul Islam answers every one.
Works well with.
Your turn
Let’s grow.

[30] minutes, no slides. You leave with the [8] numbers we’d put on your dashboard.
Or write to [hello@domain.com]