
Case study · Paid media

Spring launch: −[38]% cost per new customer.

[Client] launched a new serum with ads that had stopped working. We rebuilt the creative testing and moved the budget every Monday. [Eight] weeks later each new customer cost [38]% less, on the same budget.

Client
[Client]Skincare · direct to consumer
Platforms
Shopify · Meta · TikTok
Duration
[8] weeks
Period
[Mar–May 2026]
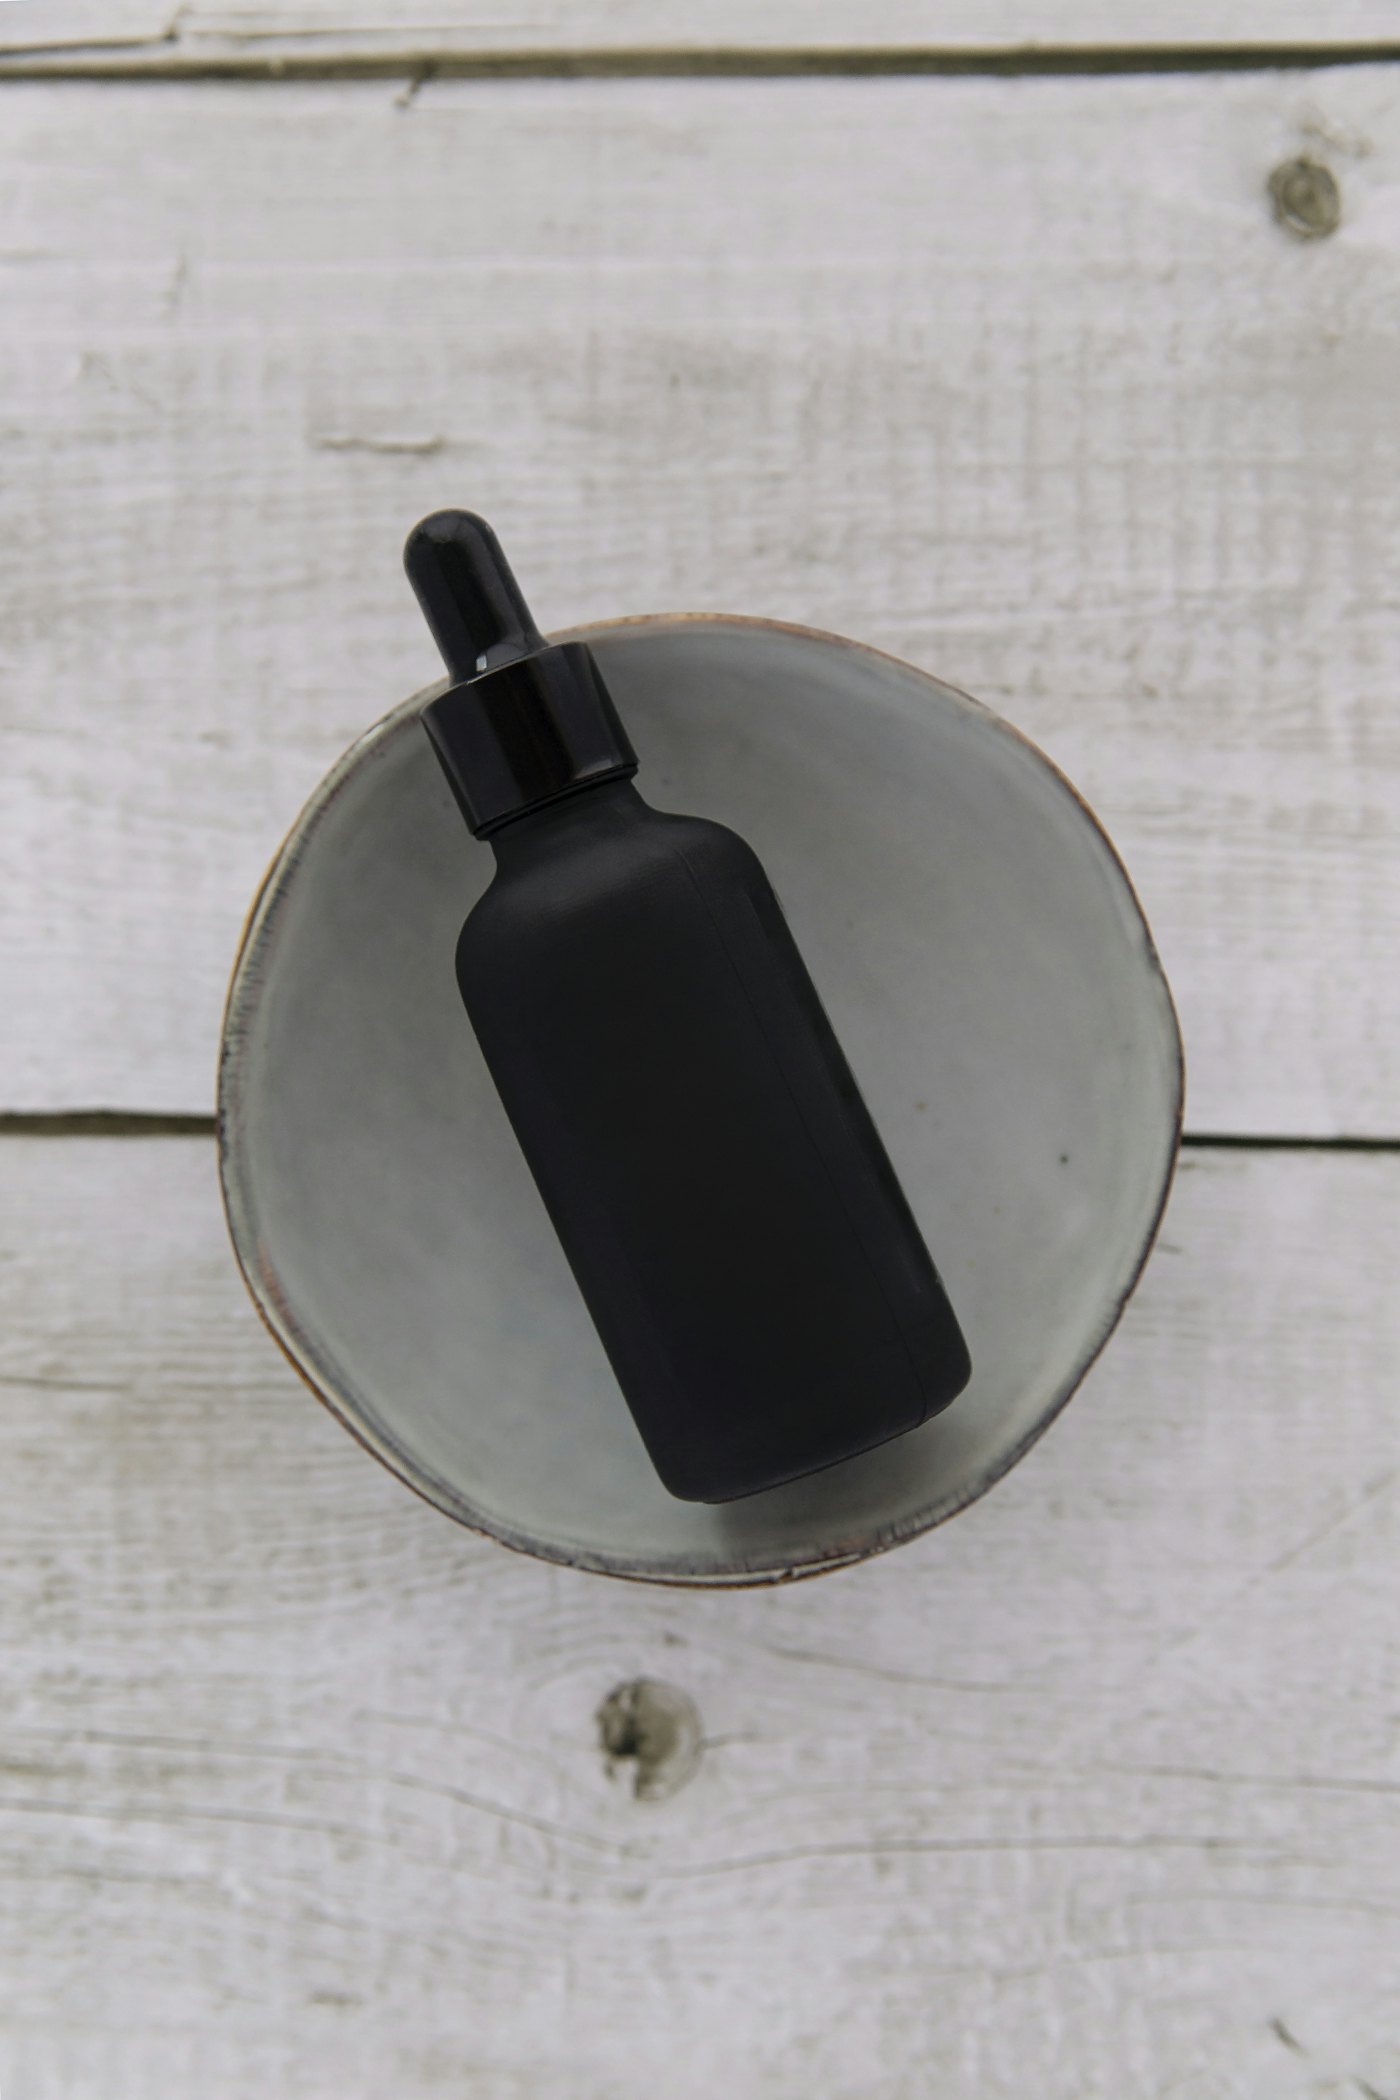
[Client]’s new serum in a stone bowl
[Client] · the spring serum
Results

The numbers.

Measured in [Client]’s own Shopify and Meta and TikTok data, [Mar–May 2026].

  • Cost per new customerfrom [$42][$26]−[38]%
  • Return on ad spendfrom [1.9]×[3.1]×+[63]%
  • New customers a monthfrom [1,180][1,940]+[64]%
  • Monthly ad spendfrom [$50k][$50k]Same
01 · Situation

Ads that had stopped working.

[Client] sells skincare online, almost all of it through Shopify. Before the launch, [3] ads carried most of the Meta budget, and the cost of each new customer had risen for [11] weeks in a row.

The team wanted a spring launch that paid for itself. We had [8] weeks and the same budget.

  • [$42]cost per new customer
  • [3] adscarrying [80]% of spend
  • [11] weeksof rising costs
02 · What we tested

Twenty-four ads in eight weeks.

Every week we shipped [4–6] new ads against the current best: UGC hooks, studio shots and static offers. Each one ran on a slice of the budget until it reached about [50] orders, then we read the cost per order.

  1. E01Studio ads, new cutMetaCPA [$44]Cut
  2. E02UGC hooks, round oneMetaCPA [$31]Won
  3. E03Static offer with a free giftMetaCPA [$39]Cut
  4. E04UGC hooks, round twoMeta, TikTokCPA [$26]Scaled
  5. E05TikTok Spark adsTikTokCPA [$29]Won
  6. E06Brand terms inside PMaxGoogleNo liftCut
03 · What we cut

What we cut, and why.

A test that loses gets cut on the Monday it loses, not at the end of the quarter. Three of the six didn’t make it.

  • Studio ads, new cut[$44] per order against [$31] for the first UGC hooks. Cut in week [3].
  • Static offer with a free giftMore clicks, fewer orders: [$39] per order, and a lower basket. Cut in week [4].
  • Brand terms inside PMaxNo lift after [3] weeks: shoppers searching the brand bought anyway. Cut in week [6].
04 · What we scaled

Where the budget went.

Every Monday the budget moved toward the ads with the lowest cost per order. By week [8], UGC hooks carried most of the spend.

Share of ad spend by ad type
Week 1[68]%[20]%
Week 8[76]%
Timeline

Week by week.

  1. W1

    Audit

    Pixel fixed and [3] years of ads reviewed.

  2. W2

    Plan

    A [24]-ad backlog and the budget split agreed.

  3. W3

    First tests

    UGC hooks beat studio ads by [29]%.

  4. W4

    Cuts

    Studio ads and the free-gift offer cut.

  5. W5

    Budget moves

    [60]% of spend moved to the UGC winners.

  6. W6

    TikTok

    Spark ads tested on [10]% of the budget.

  7. W7

    Scale

    Round-two hooks take [75]% of spend.

  8. W8

    Review

    Sprint review and the next [6] weeks planned.

From the work

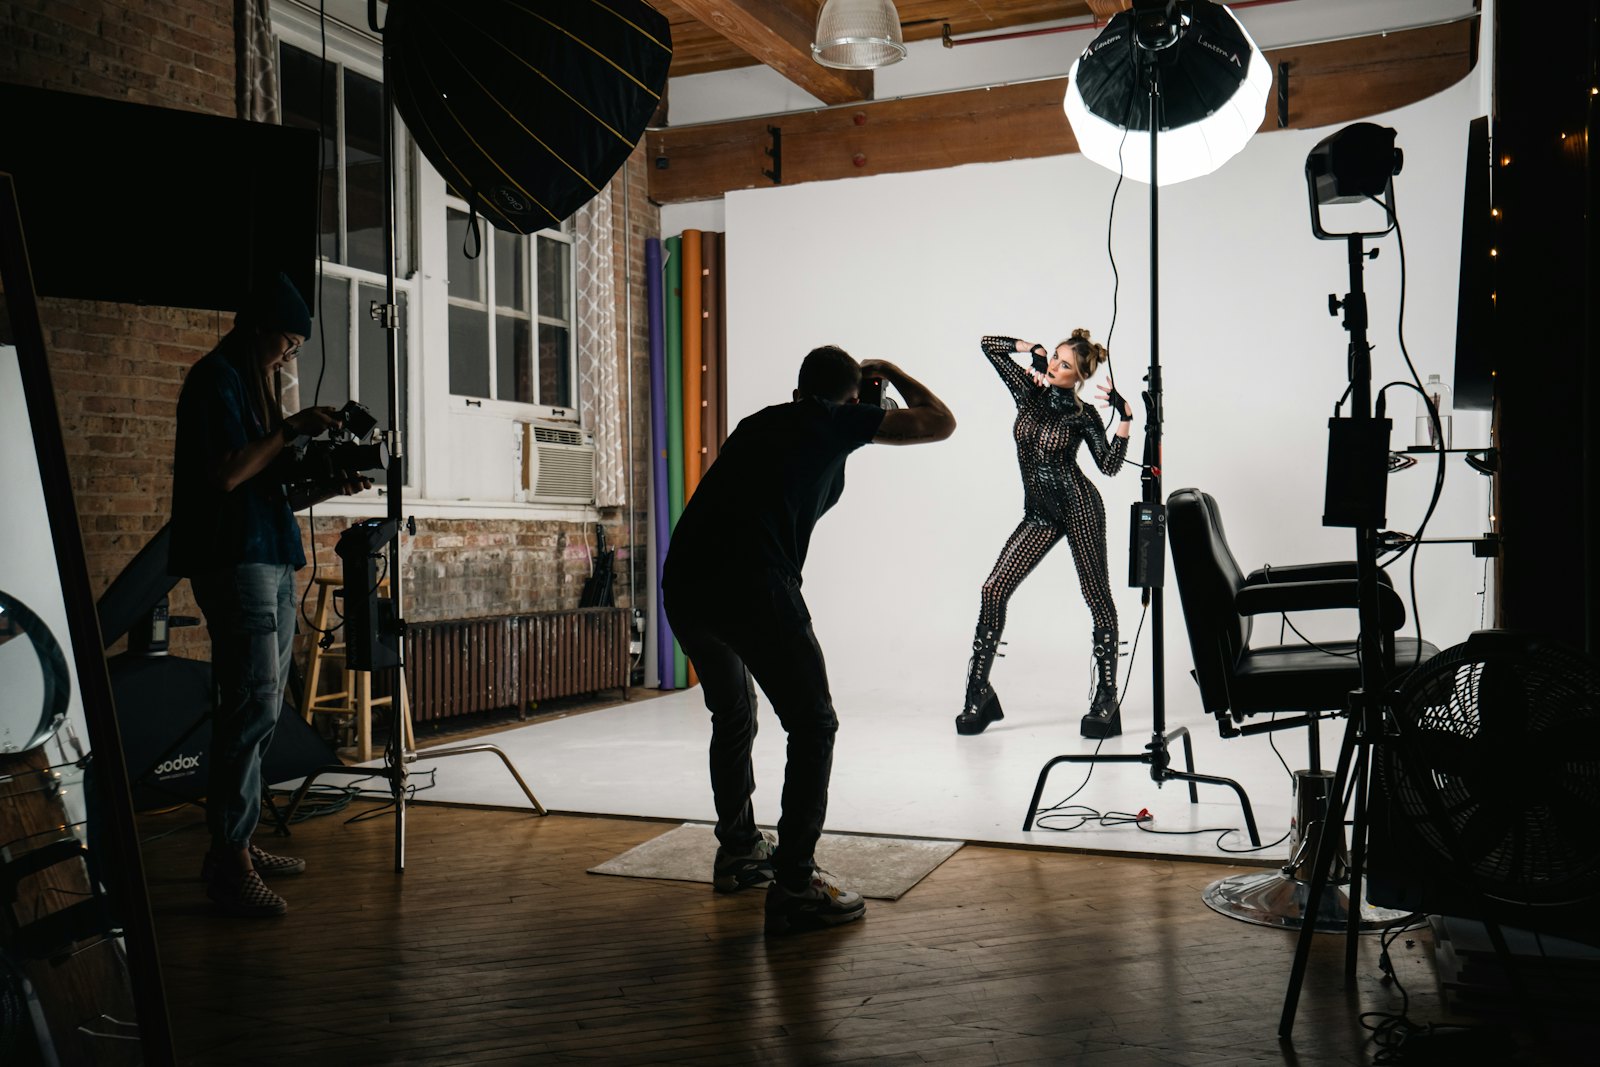
The UGC shoot for [Client] in week three
Week [3] · the UGC shoot
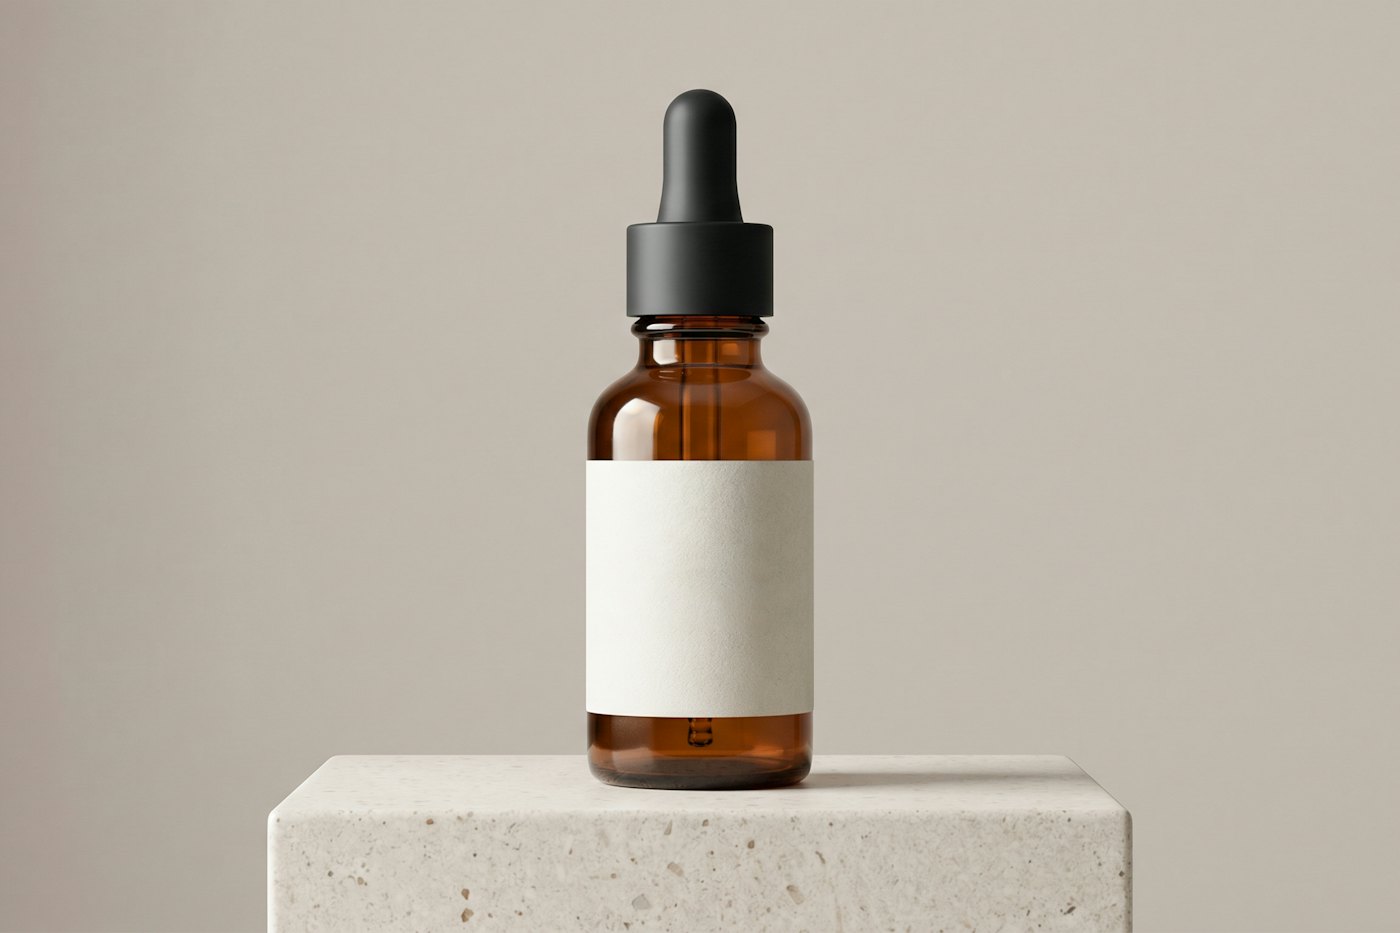
The serum on a plinth, product shot for the static ads
Static offer · cut in week [4]
A shopper paying by phone
Checkout · mobile, [82]% of orders
[Name], [Founder]Video · [2:14]

In [Client]’s words

“[The Monday report is the only marketing update our whole team actually reads.]”
[Name][Founder], [Client] · Skincare−[38]% cost per new customer

Your turn

Let’s grow.

Book a strategy call

The next case study could be yours. [30] minutes, and you leave with the first [3] tests we’d run.

Or write to [hello@domain.com]